
Logic Analyzers are inexpensive devices that allow you to just take a look at what a small number of pins on a chip are up to. They can be hooked into software like PulseView to read pin output and decode it into something more useful. Many decoders are available, but in this introduction we’ll have a quick look at PulseView and reading (decoding) UART data.
I’ve previously written about UART and how to find them with a JTAGulator, but here’s a different approach.
Reading UART with an Analyzer
One of the downsides of using the JTAGulator to read UART is the way in which it determines what it’s found. It goes through every permutation of pinout and baudrate and displays a short piece of what it sees. The intention being that it will write on one pin (Tx) and you’ll see that output on another (Rx). However, sometimes you just can’t spot the correct pinout in its output – or maybe lack of Rx pin is preventing you getting useful output (e.g you can’t transmit to the target board and cause detectable output).
With a Logic analyzer you can test multiple pins at the same time looking for just output. This can be as simple as connecting a number (usually 8 or 16) of possible UART Tx pins to the logic analyzer and watching them whilst the device performs an action that should result in serial output (such as turning on, which usually leads to boot messages being written to UART).
Here’s the logic analyzer I’m using for this example:

Here I’ll wire in the analyzer to my target device, to allow us to see how UART looks in the analyzer’s view. The device I’ll be using has a nice set of exposed pins which you might (correctly) guess are UART and JTAG:

Of course, if you were testing this system you wouldn’t know this was UART and JTAG, but you could simply cable in each pin of the highlighted connectors and determine that you’ve found UART using the analyzer. I’ll describe how here.
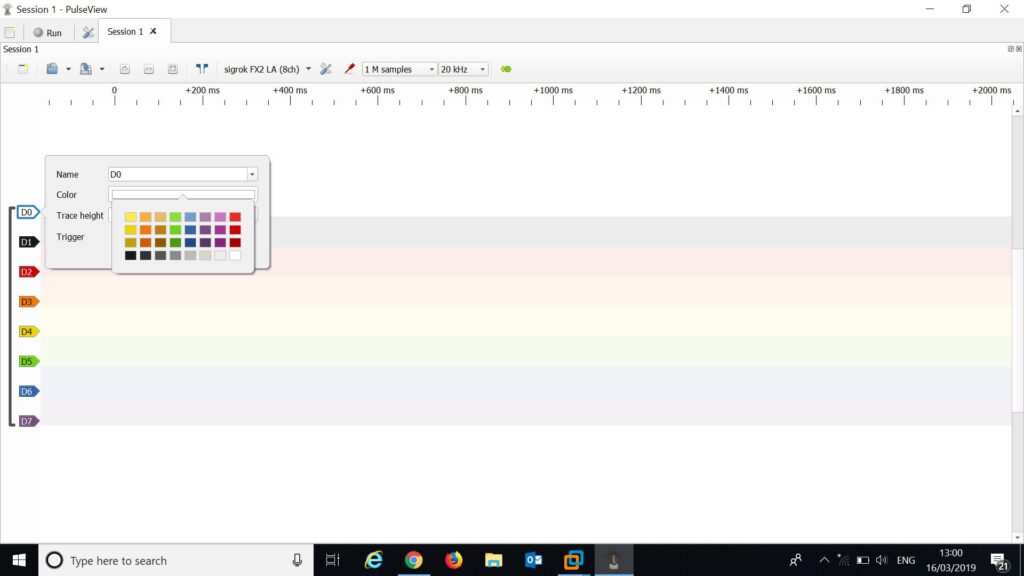
To get useful data out of the analyzer you’ll want to grab a copy of PulseView. Once you’ve loaded PulseView it’ll give you a view of all 8 channels. If you test wires don’t match the colours of the UI you can “correct” that, to save pin out confusion by selecting (left click) the channel in the user interface and then selecting a colour:
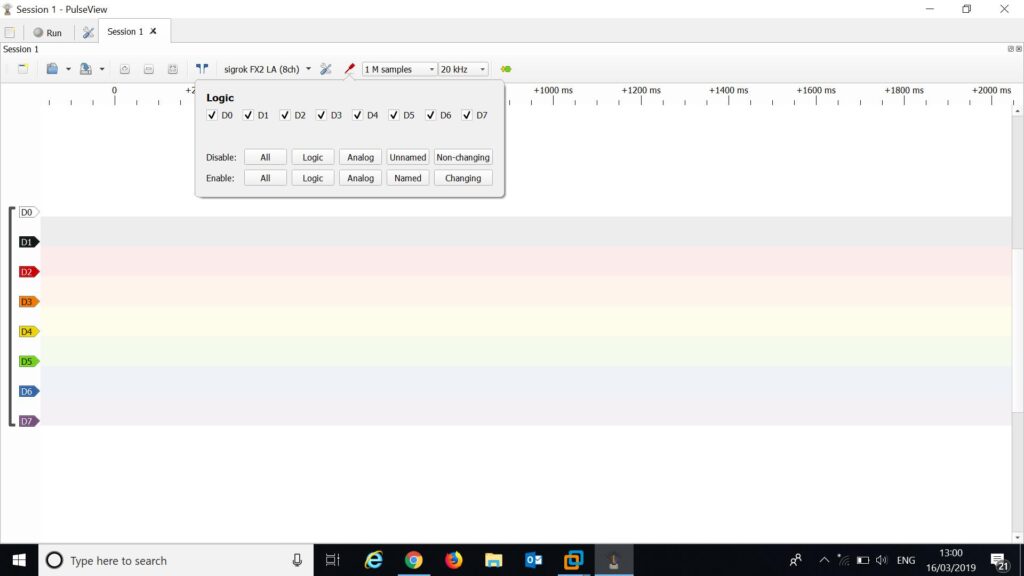
I also reduce the channels in view to the channels that I have wired in. I’ve only used channel 0 and 1 for this example, so you can remove the unnecessary channels with the channels menu at the top.
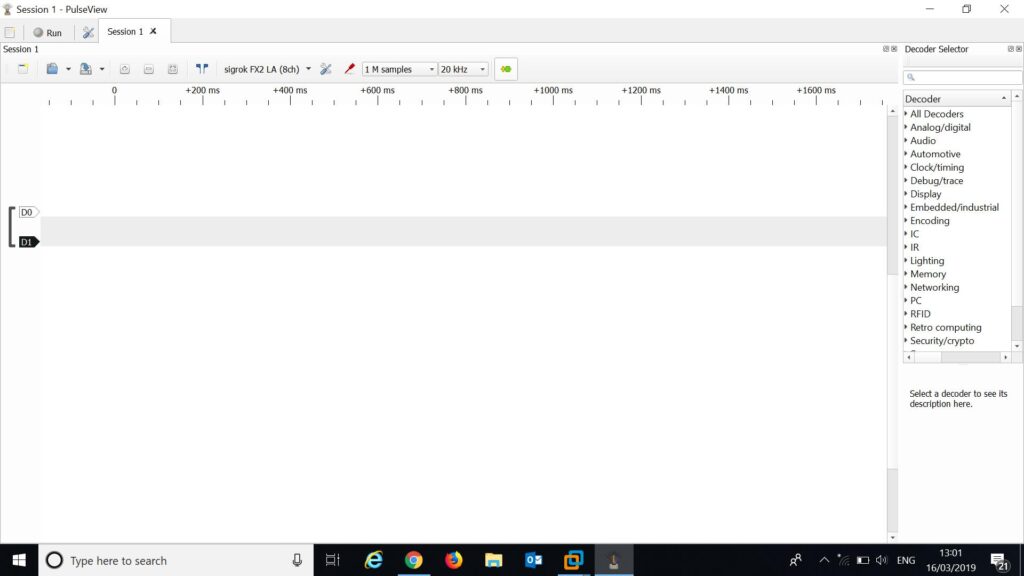
As we’re looking for UART in this example, you can set up a decoder to display received ascii. This can be done by selecting decoders on the right of the top menu (next to the samples/frequency option). This opens the decoder menu on the right, where you can search for and select UART.
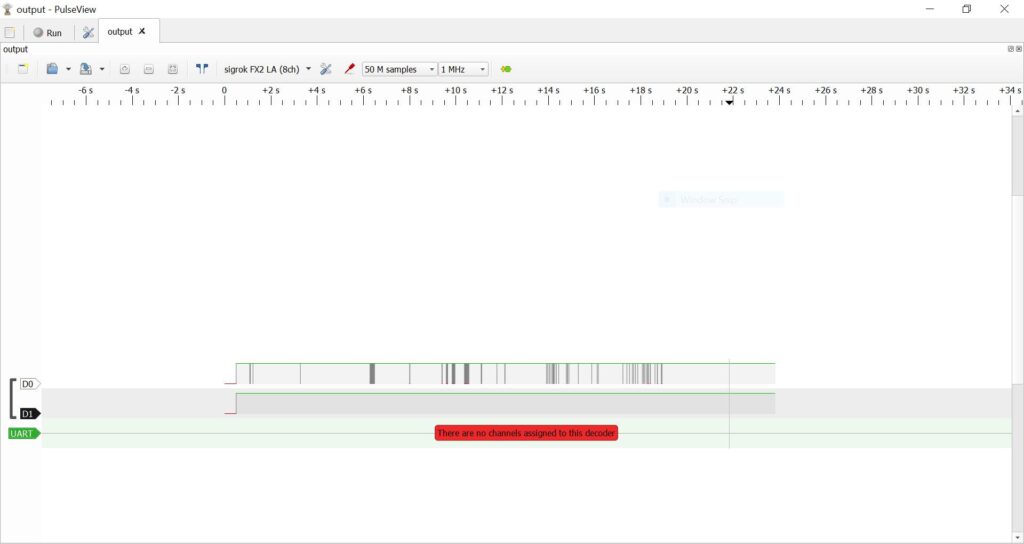
At this point you’ll get a new channel for UART. You can change the samples and frequency options (found next to the decoders button) to 50M and 1 MHz. That will same at a rate of 1 MHz and gather 50 M samples – or 50 seconds of output. Click “Run”, power on the device, wait 50 seconds for the analyzer to gather data.

Here you can see that some pins (in this case, the UART Tx pin) don’t output anything. Certain outputs (such as Clock) are fairly predictable and easy to spot – but in this case, we get unpredictable output from one pin (D0) for around 40 seconds and then nothing more. If you performed this and gathered more than 50M samples we would continue to receive no output on D0 past the first 40 seconds. In this case that’s because we’re seeing the system boot messages and past the first 40 seconds it’s finished booting and outputs nothing further.
However, we can take a look at what the data is, and confirm that it’s UART, but setting the UART decoder to the “interesting” pin we would like to investigate. Here we set Rx to D0 and Data format to ascii.

Once you confirm those changes, you can take a look at the received data and you should see something like this:
Zoom in on that green UART decoder line and see something interesting:
Launching kernel decompressor
Starting LZMA uncompression Algorithm
Copyright (c) 2003 Texas Instruments Incorporated
We’ve found a UART Tx pin on the target board, and in this case during power up it’s giving us the console output of the system boot process! Plus we had a neat introduction to the main options of PulseView for working with a simple Logic Analyzer 🙂
That’s it!
Introduction to Radio Hacking
In my introduction to hardware hacking, I mention that radio systems may be part of the attack surface for a hardware device penetration test. So I thought I’d give a gentle introduction to hacking with an SDR here! Firstly, what’s an SDR? It stands for software-defined radio, and refers to [...]| Play | Cover | Release Label |
Track Title Track Authors |
|---|